----
Markov Chains explained visually
// FlowingData
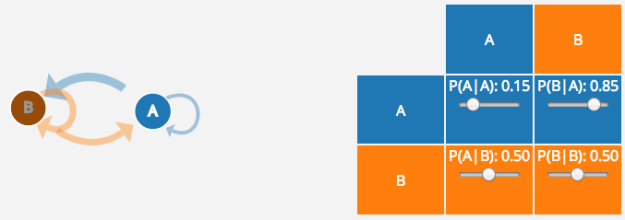
Adding on to their series of graphics to explain statistical concepts, Victor Powell and Lewis Lehe use a set of interactives to describe Markov Chains. Even if you already know what Markov Chains are or use them regularly, you can use the full-screen version to enter your own set of transition probabilities. Then let the simulation run.
Nice. Should be especially useful for educators.
----
Shared via my feedly reader
Sent from my iPhone

No comments:
Post a Comment